post-mortem debugging in a jupyter notebook
One coding tool I’ve come to greatly appreciate and yet which I rarely see discussed on the internet is post-mortem debugging. In short, if your code has crashed, a post-mortem debugger will not only tell you where your code malfunctioned but also launch an interactive interpreter that drops you exactly into the crash location so that you can play around with the variables involved and see what went wrong.
For example, if your code crashed when trying to execute the 14th line of a function, the post-mortem debugger would open up right at the 14th line of that function, and you would have access to all the function arguments and variables that were accessible at line 14. Since the debugger is interactive, you can view these variables and manipulate them, call other functions, and do basically everything you might normally do from a standard interactive interpreter. You can even step in and out of functions to change the scope that the debugger has access to. Of particular interest to me as a scientist has been the ability to make plots from within this interactive interpreter, since this often provides much more detail than looking through a large table of variables or values, as one might do with a more conventional debugger.
In Python, the interactive debugger is called pdb, and it is included in the standard library (meaning you don’t have to install anything extra). I won’t discuss the details of everything you can do with it (which includes far more than just post-mortem debugging), since these have been discussed elsewhere. If you’re interested, Python Conquers The Universe has a very nice tutorial that explains the basics of how to use pdb in the more standard context, in which the debugger gets launched at a prespecified point in the code base before any crashes occur. Once you’re inside the debugger, however, all of the special commands are the same, regardless of whether you called it in the standard way or post-mortem.
To get a feel for post-mortem debugging, we’ll now go through an example of how to use pdb to visually diagnose the nature of an error. In this example, we’ve called a function from inside a Jupyter notebook cell that loads a small dataset and attempts but fails to perform a linear regression on it. The code for the function is shown below.
import matplotlib.pyplot as plt
import numpy as np
from sklearn import linear_model


def fit_linear_model(DATA_FILE):

    data = np.load(DATA_FILE)

    lm = linear_model.LinearRegression()
    lm.fit(data[:, :5], data[:, 5])

    fig, ax = plt.subplots(1, 1, tight_layout=True)

    ax.bar(range(5), lm.coef_, align='center')
    ax.set_xlabel('coefficient')
    ax.set_ylabel('value')

    return fig
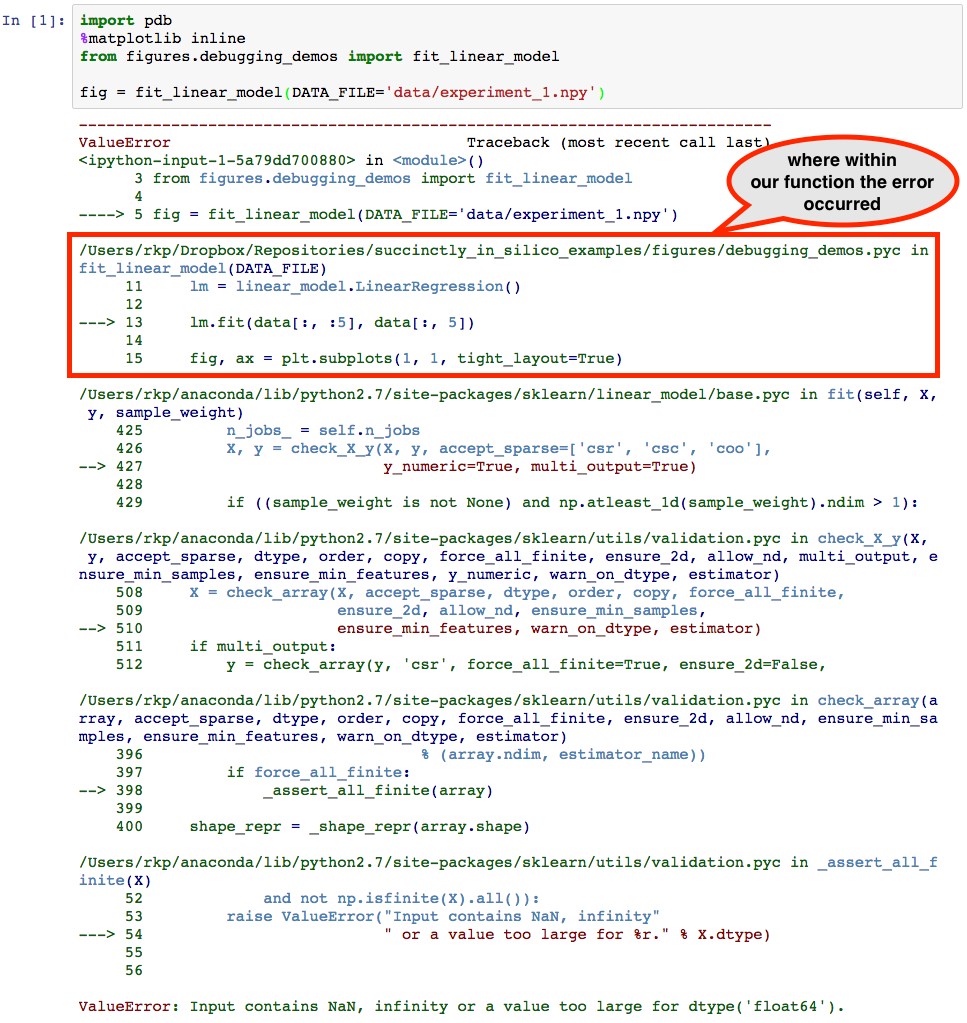
In order to use the post-mortem debugger, we must first import pdb and the function of interest (the %matplotlib inline statement enables plotting within the notebook), then call the function:

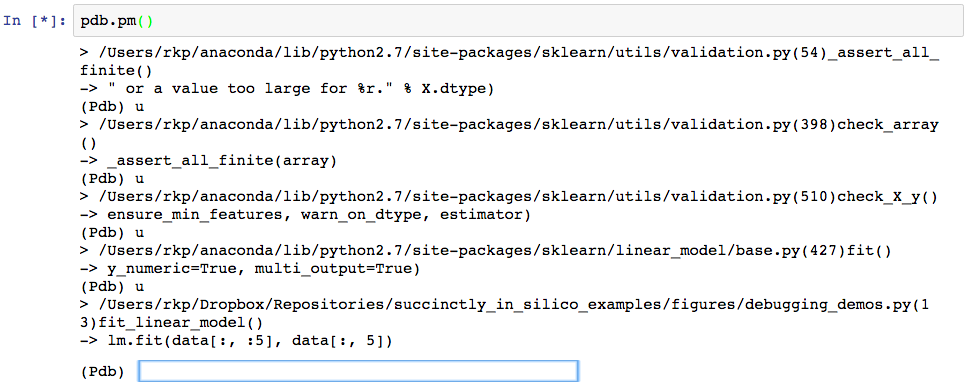
Apparently something has gone wrong. The error mesage suggests that our data might have had invalid values in it, so let’s find out if that is case. To launch the interactive debugger, we simply make a new cell below the error and call pdb.pm(). Since pdb was imported before calling the malfunctioning function, this opens up an interactive interpreter at the location of the crash point, as can be seen below.

Since the error actually occurred rather deep within sklearn’s linear_models library (note the first line following the “>”, we first have to step “up” several times to get back to the line that we called to fit the linear model. The pdb command to do this is simply, “u”, hence the several “(Pdb) u”s in the code that follows. (Note that here we are making the assumption that the error was not in the linear_models library, but rather in our usage of it, which is generally a safe assumption to make when dealing with well maintained libraries.) The text following “(Pdb)” every few lines are the commands we’ve entered at the pdb prompt.

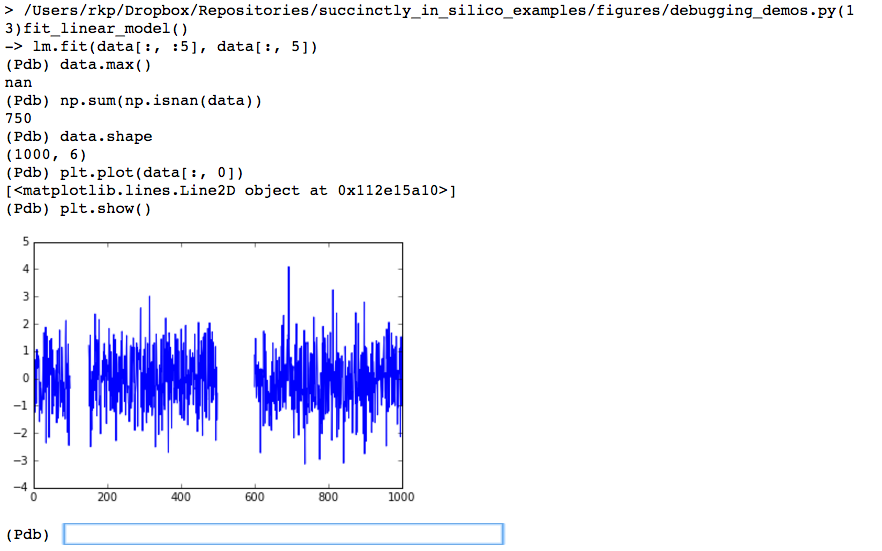
Now that we are at the crash point inside the function that we’ve written (line 13), we can figure out what went wrong with how we called the function. Informed by the original error message “Input contains NaN, infinity, or a value too large for dtype(‘float64’)”, we first check whether any of the values in the data set seem unreasonably large.

And in fact, trying to find the maximum value in the data matrix reveals there seems to be a NaN in there somewhere. Let’s figure if it’s just one or two points that were off, or if this is going to be a real problem.

Here we see that there are actually quite a few NaNs. Since there are 750 NaNs in a dataset that is only 1000 rows large, this seems like it’s going to be a bigger issue. As a final investigation we’ll now plot the data from within the debugger to try to see if the NaNs are randomly scattered about (in which case we could maybe get away with interpolating their values), or if there is some sort of pattern to them, which will inform us as to how we should clean the data before we work with it.

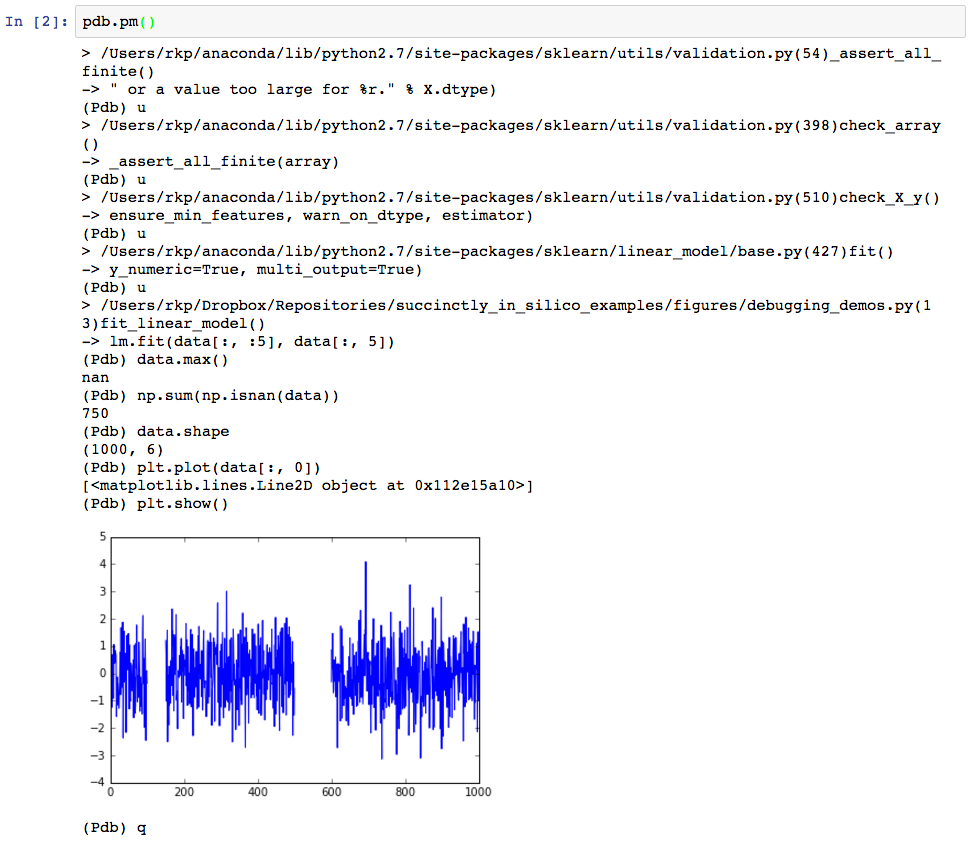
This shows us that in fact the NaNs (indicated by gaps in the plots) actually come in large sections. If these data were from a sensor, this might indicate that something had gone wrong with the sensor for a couple of extended periods of time. We thus need to decide whether we should recollect the data, or if we should figure out how to deal with the missing records (for example, either ignoring them or interpolating their values). And all of this has been revealed quite quickly by pdb.pm().
To quit the debugger, we can simply type “q” and hit Enter, which takes us back to the original notebook.

My goal here has been to illustrate how useful, yet relatively simple to use, a post-mortem debugger can be, and to demonstrate the basics of using the one included in Python’s standard library. I’ll admit that pdb is not perfect, and that it lacks some features typically included in command line interfaces, such as tab completion and using the UP arrow to access previous statements, but it is still pretty nice. (Actually, the ipdb module solves many of these problems, providing a debugger with a more IPython-like interface, but it is not included in Python’s standard library and must be installed separately – though this is actually pretty straightforward.)
As I’ve mentioned, one main advantage I have found to using the pdb debugger is being able to stay within a Jupyter notebook while doing the debugging. Again, this is particularly useful if your code is actually being executed on a remote server, but you want to use a browser on your local machine as your primary interface to it. The second main advantage, as we demonstrated at the end of the example, is the ability to make plots inside the debugger, inside the Jupyter notebook, since plots often help us very quickly identify problems in scientific code.
The final point I would like to make, however, is that even though post-mortem debugging is very useful, it still comes a far way from ensuring that your code is written correctly and producing the correct results. Using a debugger, you can pretty quickly get your code to execute without any hiccups or heart attacks, but you still might not be able to trust the plots or tables that are displayed at the end. Next time we’ll talk about unit testing, which has been one of the key approaches to ensuring correct code behavior developed in the commercial software industry, and how to efficiently incorporate it into a scientific workflow.